The step towards productivity
Earned value management is not an earning for effort expended. It is an earning for results gained.
To effectively apply earned value management a step towards productivity must be made. Earned value is the measurement of results against efforts. EVM is not an earning for effort expended. It is an earning for results gained. Regardless of the effort expended 50% gained is only 50% gained when it actually required 80% of the effort 30% is lost and requires 60% to recover within the remaining time.
The project team must develop a Work Breakdown Structure to capture all project scope and provide reference to the Cost Baseline and the Schedule Baseline. Each planned unit, placed, build, or produced has a predetermined planned cost in time.
The project team also needs to have a Scope Management Plan which outlines how to correctly track productivity. Productivity is measured in daily intrinsic measurable quantities or otherwise units placed. The benefit is to be able to develop a cumulative histogram of units placed, build, or produced by category over a certain period of time.
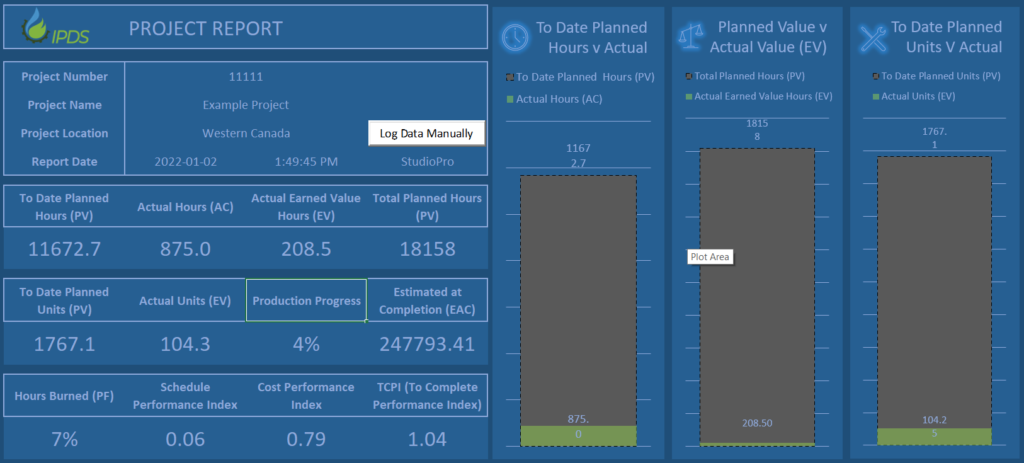
Then the data is combined as described below and calculated with the formulas cited in Introduction to earned value (EV) in project cost management
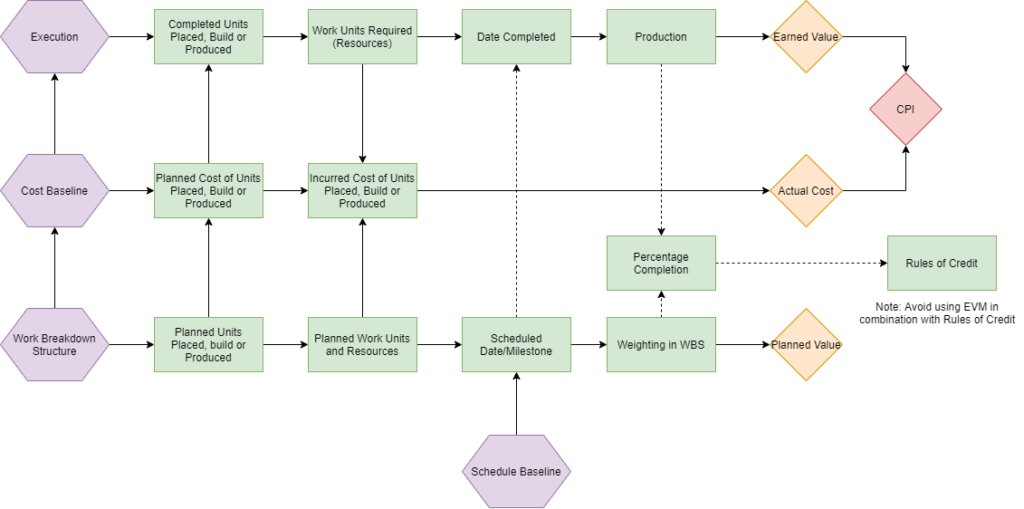
Earned Value Analysis is possible as soon committed cost (accruals) and incurred cost data becomes available and is compared against production and schedule as outlined in the graphic diagram above and summarized in a simplified project report.
Step 1: Developing a project baseline
Develop a project baseline based on the work breakdown structure
To develop a baseline the most important thing is to establish a correlation between the WBS code of accounts and its activity attributes such as planned start and finishing date, total amount of units and type of units as shown in the example below:

Step 2: Determine units and quantities
Determine total planned units, daily planned units and actual units performed.
The subsequent step is to determine the total planned units, the total planned units to date, and the total actual units to date. In the previous step, a start date and a completion date have been defined for each code of account, total units are divided by total days to determine daily quantities to be installed. Then a comparison is drawn by observing how many actual units have been placed during the first three days compared to how many where supposed to be placed in those same three days.
Example: Imagine a civil construction project with duration of 10 days. During those 10 days a total of 500 cubic meter of concrete must be placed. Each day 50 cubic meter must be placed to maintain schedule and budget. If the concrete team was able to place 80 cubic meter each day, by the third day the team will be 90 cubic meter ahead of the planned units.
Data needs to be collected in a organized and well sorted manner to perform adequate and correct analysis, see example below:

Step 3: Determine necessary effort and hours
Determine total planned hours, daily planned hours and actual hours performed.
The third step is similar to the second step but instead of units now hours must be used. Determine the total planned hours, the total planned hours to date, and the actual total hours incurred. In the first step, a start date and a completion date have been defined for each code of account, make sure hours are correlated to each code of account accordingly at all times.
Expanding on the previous example: During the period of 10 days a total of 1800h have been budgeted for concrete placement. Dividing the 1800 into 10 days results in 180h/day to meet both schedule and labor cost (assuming that the hourly rate will remain consistent throughout the project). This means that by the third day after start date at least 150 cubic meter of concrete should have been placed and 540h direct work hours consumed to remain neutral on schedule and cost.

Step 4: Match and Compare
Compare daily quantities and planned hours vs actual quantities and actual hours
The first three steps are mostly related with developing the project baseline by integrating information from the Work Breakdown Structure (WBS), Activity List, Activity Attributes, Duration Estimates and Scope Definition. The fourth step is focused on correlating daily production and effort (quantities and hours) in comparable manner to the previously developed project baseline. The earned value management system must be set up in such way that both data sets with planned quantities and planned hours vs actual quantities and actual hours always match by planned date to actual date:
-
Baseline
Develop the baseline, code of accounts, names, dates and quantities.
-
Quantities
Determine daily units and quantities required for each day after start date.
-
Effort
Determine daily effort required for each day after start date.
-
Match
Match and compare daily planned vs daily actuals
The whole premise of applied earned value management is to monitor and track daily performance of production and hours. Production must always be measured with measurable and quantifiable units, and it needs to be done daily. The following tables can be used as example how it was done in this case:

Daily production should be recorded by means of a “Daily Production Tally Sheet” and hours can be deducted from the “Daily Hour Sheets”. Some organizations like to combine both into a single format in conjunction with specific cost center codes. In any case information of production and effort must be logged by date as shown in these two examples.

Step 5: Complete the Earned Value Analysis
Finally, perform the earned value analysis by combining and calculating both data sets for quantity and effort using EV formulas.
Once both data sets with planned quantities and planned hours vs actual quantities and actual hours have been matched by planned date compared to actual date a full earned value analysis can be performed. Refer to Introduction to earned value (EV) in project cost management for more detail and how to use earned value analysis formulas.
With the table and the graphic it becomes evident that the project team started the concrete placement later than planned and then produced significantly more than planned with the same resources. After the third day the production drops and the project team finishes later than originally planned. There could be various reasons as to the why behind these events, but this is not part of this article. The important thing is to understand the objective of earned value analysis. The objective is to represent project information in such a way that thoughtful decisions can be made to adjust the expected project outcome.
In this article, earned value analysis has been simplified to a single commodity and cost data has also been simplified assuming a direct hourly rate only to facilitate the understanding of the concept and its application. Earned value analysis is usually tailored to the whole project and requires a significant administrative effort and knowledge.